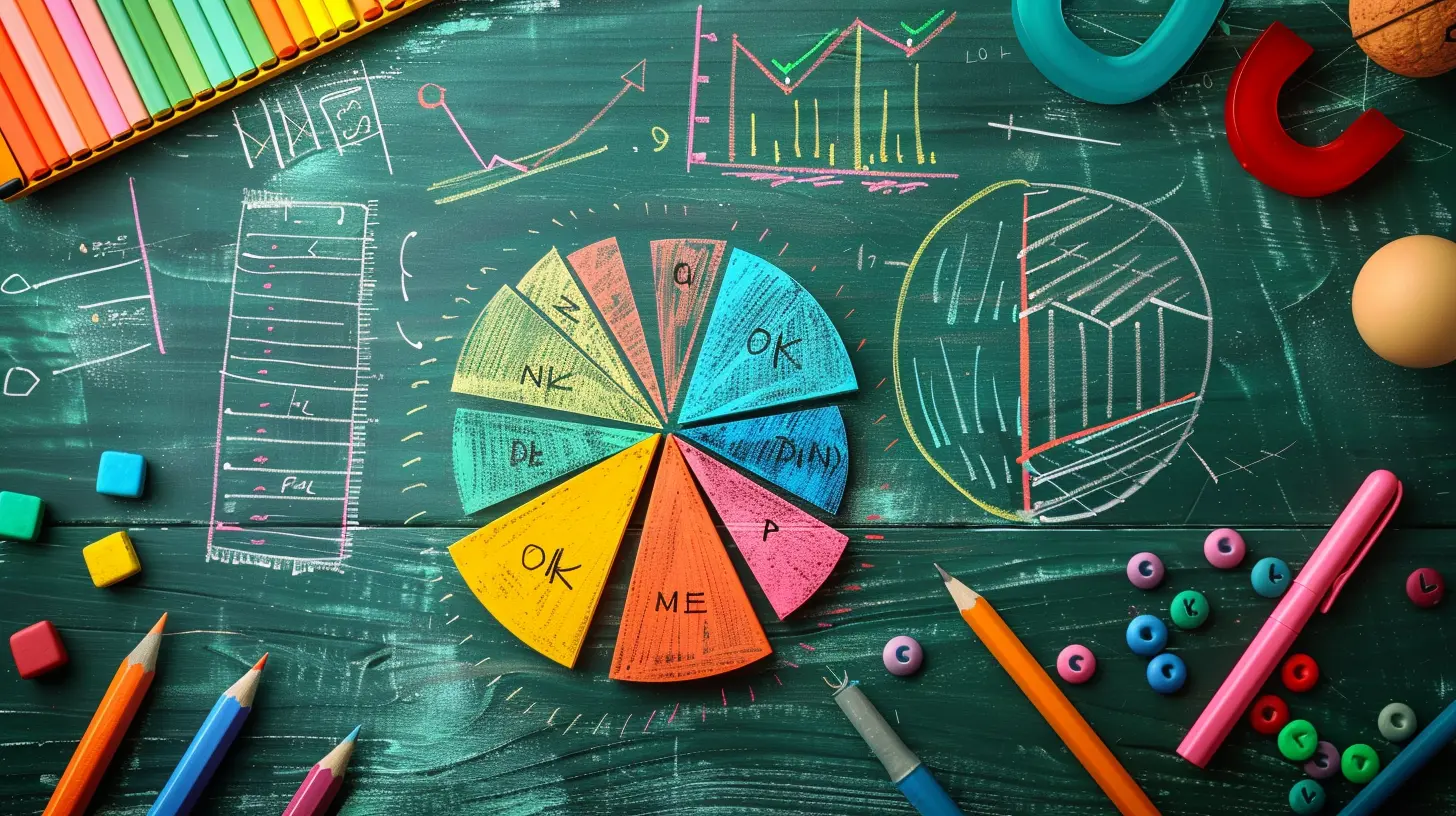
Visual Learning: How Diagrams and Charts Aid Math Understanding
26 June 2025
Let’s be honest—math can feel like a foreign language sometimes, right? All those numbers, formulas, and symbols dancing across the page can leave your brain spinning. But what if I told you there’s a way to decode that complex language and make it way more digestible? Enter the world of visual learning.
Visual learning isn’t just a trendy buzzword; it’s a game-changer for anyone struggling to grasp mathematical concepts. Whether you’re a student sitting in a stuffy classroom or a parent trying to help with homework you haven’t seen in decades, visual tools like diagrams and charts can turn confusion into clarity.
In this article, we’re diving deep into how and why visual aids are so powerful when it comes to understanding math. Grab your mental toolbox—we’re about to fill it with some seriously useful tools.
Why Do We Struggle With Math in the First Place?
Before we dive into the power of visual learning, let’s put the problem under the microscope.Math is abstract. It's not like reading a story, where you follow characters on a journey. It’s more like solving a puzzle with missing pieces—one where you don’t even know what the final picture is supposed to look like. That’s intimidating.
And while some people have a natural knack for numbers, others just need a different approach to really "get it." That’s where visual learning comes in. It helps bridge the gap between the abstract world of numbers and the way our brains naturally process information—through images.
What Is Visual Learning, Exactly?
Visual learning is a style where people think and learn better when information is presented in a visual format—think pictures, diagrams, videos, infographics, mind maps, and yes, even doodles.In math, this can mean using:
- Graphs to understand functions
- Pie charts to get a grip on percentages
- Number lines to visualize integer operations
- Flowcharts for solving problems step-by-step
- Bar diagrams when comparing quantities
This approach taps into the brain's natural strength for processing visuals. Studies show that about 65% of us are visual learners. So it makes total sense to use visuals in a subject as concept-heavy as math.
How Visuals Help Break Down Complex Math Concepts
Let’s get into the meat of it—how diagrams and charts actually help.1. They Make Abstract Ideas Tangible
Think about it: trying to explain what a function is with just words feels like describing color to someone who’s never seen it. But show them a graph, and boom—it clicks.Take quadratic equations. When you look at the formula, it might look like gibberish:
`y = ax² + bx + c`
But the second you plot it on a graph and see that perfect U-shape (a parabola), something magical happens in your brain. Suddenly, it’s not just a bunch of letters and numbers—it’s a shape, a picture. And that picture has meaning.
2. They Simplify Problem Solving
Ever spend 10 minutes staring at a word problem, feeling like your brain is melting? Turning that problem into a diagram can be like turning on the lights in a dark room.Let’s say you have a question about trains leaving different stations at different times. Sounds like a nightmare, right? But draw it out—tracking the trains’ movement on a timeline or using a diagram—and it becomes way easier to figure out who arrives when.
It's not cheating—it's smart strategy.
3. They Help Connect the Dots
One of the hardest parts of math is seeing how different concepts connect. That’s where charts and concept maps shine.Take a concept map that shows how fractions relate to decimals and percentages. Instead of learning them as separate topics, you start to see them as branches of the same tree. That big-picture understanding helps concepts stick and makes future learning way smoother.
The Brain Science Behind It
Let’s geek out for a second.Our brains process visuals 60,000 times faster than text. That’s not a typo. Sixty. Thousand.
Here's why: the human brain is wired for visuals. Over half of the brain is dedicated to processing visual information. When we see something, our brain doesn’t just store the image—it creates associations, recalls memories, and builds connections almost instantly.
That’s a big deal in math, where retention and understanding go hand in hand. So, when a student sees a vivid diagram instead of plain text, the odds of actually remembering—and understanding—it go way up.
Different Types of Visual Aids in Math (And How to Use Them)
Let’s run through the visual MVPs—those tried-and-true tools that make math feel less like a maze and more like a roadmap.1. Number Lines
Perfect for visualizing operations with positive and negative numbers, fractions, and decimals.Use them when:
- Teaching addition and subtraction
- Comparing numbers
- Understanding distance and direction
They solidify the why behind the how.
2. Graphs (Line, Bar, and Pie)
Graphs are incredible for showing relationships between variables.Line graphs help with:
- Tracking change over time
- Visualizing linear equations
Bar charts work great for:
- Comparing quantities side-by-side
Pie charts are perfect when:
- Showing parts of a whole
- Working with percentages
They help move the lesson from "guesswork" to "got it."
3. Venn Diagrams
Ideal for teaching set theory and logic.They illustrate:
- Union and intersection
- Commonalities and differences
Crazy simple but crazy effective.
4. Flowcharts
These are step-by-step guides with arrows that show the process of solving a problem. It’s like giving your brain GPS.Use them for:
- Word problems
- Multi-step equations
- Problem-solving strategies
5. Area and Geometric Diagrams
Shapes, formulas, and measurements go hand-in-hand here. Drawing out the geometry helps students:- Visualize what's happening
- Understand properties of shapes
- Remember formulas with ease
Even something as simple as dividing a rectangle into smaller rectangles can help grasp the distributive property.
Real-Life Examples Where Visuals Make All the Difference
Still not convinced? Let’s look at some real scenarios where visual learning saves the day.Example 1: Fractions with Pizza
Imagine trying to explain 1/4 + 1/2 verbally. Now imagine showing it with pizza slices.You can instantly see that 1/2 equals 2/4 and 2/4 + 1/4 = 3/4. That’s tasty math. Literally.
Example 2: Algebra with Balance Scales
Use a picture of a balance scale to explain equations. On each side of the scale, place the terms of the equation. When students see that balance, they understand that you can't just change one side without changing the other.It’s not just symbolic anymore—it’s a real-world metaphor.
Example 3: Probability with Spinners and Bar Graphs
Let’s say we’re teaching probability. A visual spinner or die can show outcomes, while a bar graph tracks frequency. Way more engaging than just talking about chances and events.How Teachers and Parents Can Incorporate Visual Tools
You don’t need fancy software or high-tech gadgets. You just need to think visually.For Teachers:
- Use whiteboards for quick sketches- Incorporate charts, video clips, and animations in lessons
- Encourage students to draw out their thinking
- Provide visual handouts for key concepts
For Parents:
- Use household items for demonstrations (coins, blocks, slices of bread)- Watch visual math tutorials together
- Let your child draw out homework problems
- Use graph paper for messy calculations—it keeps things neat and structured
Don’t Forget—It’s Not Just for Kids
Visual learning isn’t something we outgrow. Adults benefit just as much. Whether you're prepping for a job assessment or brushing up on skills, visuals can simplify the learning process at any age.They turn the intimidating into the understandable. And once you understand, confidence follows. And that, my friend, is the real secret sauce.
The Bottom Line
Math doesn’t have to feel like a cruel puzzle with no picture on the box. With the right visuals—diagrams, charts, graphs, and more—you’re not only cracking the code, but you're also seeing it in full color.It’s like upgrading your black-and-white TV to 4K Ultra HD. Suddenly, everything just pops.
So next time math feels murky, grab a piece of paper and draw it out. Don’t just work with numbers—see them, play with them, and let your brain do what it does best: process visuals.
The numbers are still there. But now, they come with a map.
all images in this post were generated using AI tools
Category:
Math SkillsAuthor:

Madeleine Newton
Discussion
rate this article
2 comments
Isadora Fry
This article effectively highlights the importance of visual learning in math. Diagrams and charts can simplify complex concepts, making them more accessible. Incorporating visual aids can significantly enhance comprehension and retention for students. Overall, a valuable resource for educators seeking to improve their teaching methods.
October 29, 2025 at 5:06 AM

Madeleine Newton
Thank you for your thoughtful comment! I'm glad you found the article valuable and recognize the impact of visual aids in enhancing math comprehension.
Kayla Horne
Absolutely loved this! Visual aids make math so much fun and easier to grasp. Keep up the great work!
July 3, 2025 at 3:19 AM

Madeleine Newton
Thank you so much! I'm glad you enjoyed it and found the visual aids helpful!


